Automatic outlining may not be adequate for worksheets with non-numerical values or with no distinct totals (from formulas and functions).
If automatic outlining does not, or cannot, organize your data in the way you want, you can manually group your data. Take the following worksheet as an example:

We would like to group the data according to teams and divisions, but if you use the Auto Outline option under the Group button, Excel displays the following alert:

Because the data contains no formulas or functions providing numeric totals, Excel cannot implement automatic outlining for the worksheet. You can, however, create your own groupings by selecting the rows or columns that you want to group, and then clicking the Group button.
For example, if you select the members of Team 1, the Sharks (cells B4:B6), and click Data -- Group, Excel display the following box asking if you want to group by rows or columns.

If you select the Rows radio button and Click OK, Excel will provide an outline indicator and a collapse/expand button for the new grouping.
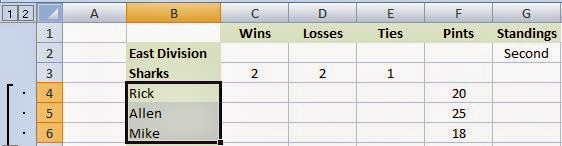
You should also notice the numbered buttons in the top left corner. Clicking on the number 1 button will show the first level of detail, and clicking the 2 button will show the second (increased) level of detail.
If you want the same procedure for cells B8:B10 (select the cells and click the Group button on the Data Tab) and then for cells B2:B10, you will end up with a worksheet like this:

No comments:
Post a Comment